Procedure to monitor SLA
Services availability SLA Monitoring
FIWARE Lab node services are the set of OpenStack services that are running on each of the FIWARE Lab nodes. The measurement of availability of those services is managed through the use of the FIWARE Lab monitoring system tool. This tool collects all the monitoring measurements from each FIWARE Lab node. This information is centrally stored, aggregated and available through the FIWARE monitoring API for both real-time raw data and aggregated historical data.
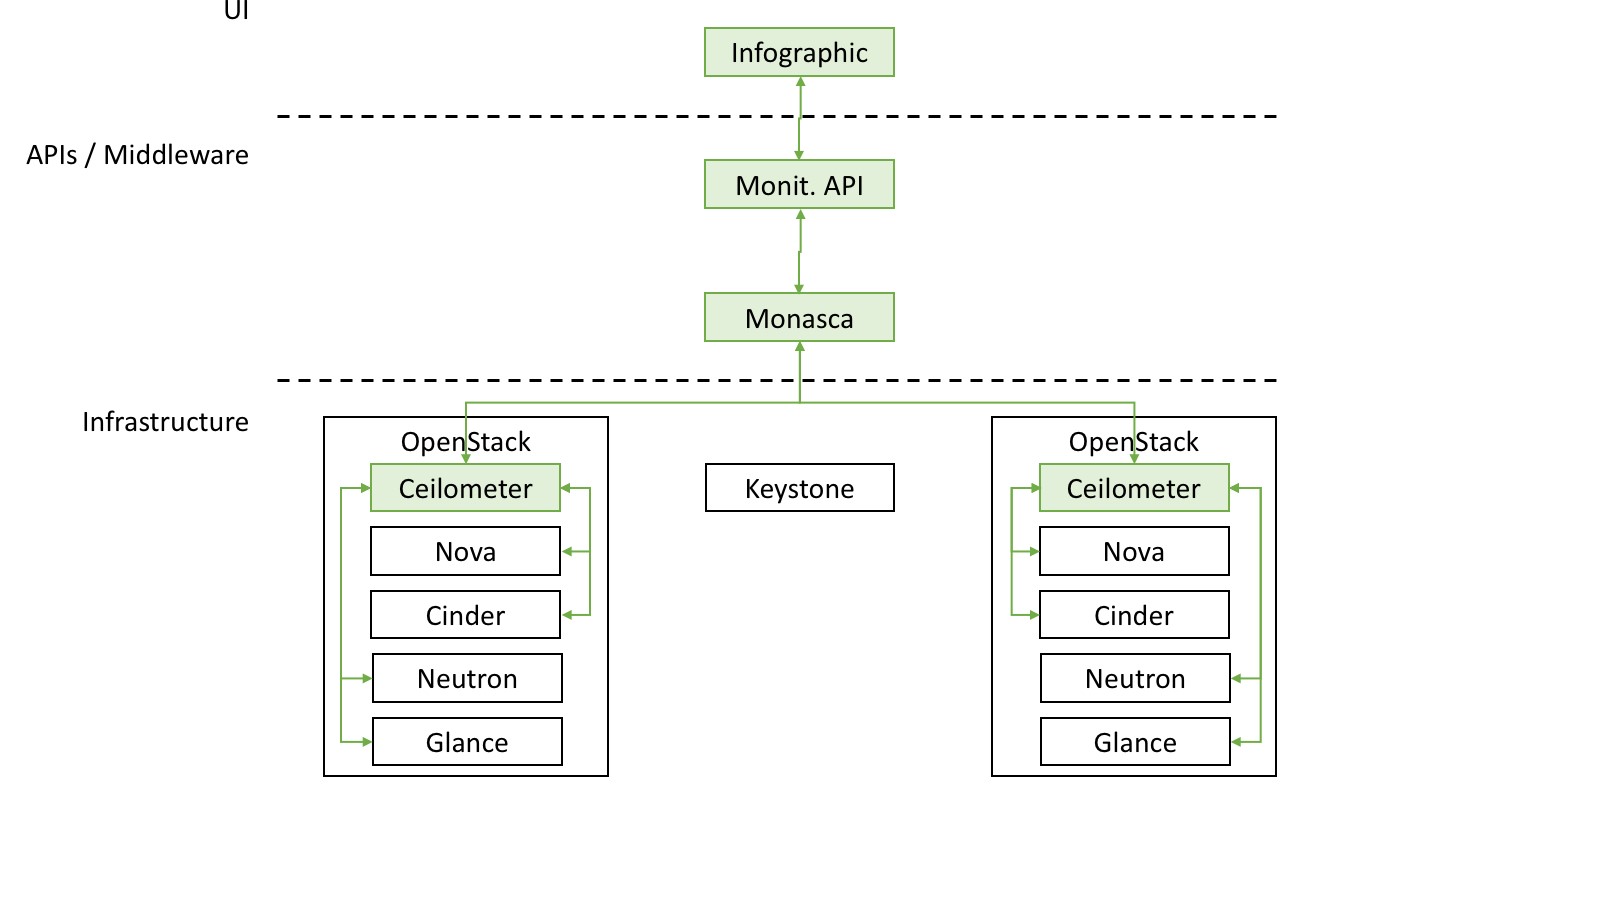
FIWARE relies on the above pipeline to calculate the FIWARE Lab node overall service availability analysing the uptime status of:
-
The OpenStack services (Computing, Networking, Storage and Authentication) using the Monasca agent component installed on each FIWARE Lab node
-
The FIWARE Lab node Sanity Check using FIWARE Lab Health
In particular the monthly averaged uptime of such services is stored in the historical monitoring database as a unique OverallStatus metric and its value should not be lower than 95%, in order to respect the given SLA. To retrieve the aforementioned monthly uptime, a specific FIWARE monitoring API (Services4Region) is used:
In order to get aggregated and averaged information, a specific monitoring API (Services4Region) will be used:
An example of SLA check performed on day 2017-11-01 and considering the services availability of October follows:
-
curl http://HOST:PORT/monitoring/regions/REGION_ID/services?since=2017-10-01&aggregate=m -
A JSON summarizing the daily uptime status of each service will be downloaded
-
The field OverallStatus will be considered for the SLA check:
{ "value": "yellow", "value_clean": 0.6789216470588236, "description": "description" } -
Should be this number below 95% over the last SLA monitoring period (a month considered in the example), it will be considered a violation.
Of course, each FIWARE Lab node responsible could check its own availability using the aforementioned API and aggregating historical data by hours, day and month.
Help-Desk tickets handling SLA Monitoring
As we have mentioned previously, the Help-Desk tickets are managed through a JIRA instance. This allows us to maintain control and operate a ticketing system to monitor the evolution of tickets with the possibility to fix resolution times and service policies. In summary, Jira is our single point of contact between FIWARE Lab service providers and the FIWARE Lab users. It is the typical definition of a Service Desk which manages incidents and service requests in the same way that it handles communication with the users. JIRA can offer a plugin called JIRA Service Desk to provide a fully featured service desk with self-service, automation, SLAs, and Customer Satisfaction (CSAT) reporting. More important for our purposes is that Jira Service Desk provides built-in Service Level Agreement (or SLA) management. It is a time metric, which lets you define how time will be measured for this SLA; and, last but not least, a goal for selected issues, which lets you define a target for the time metric. Different sets of issues can have different goals.
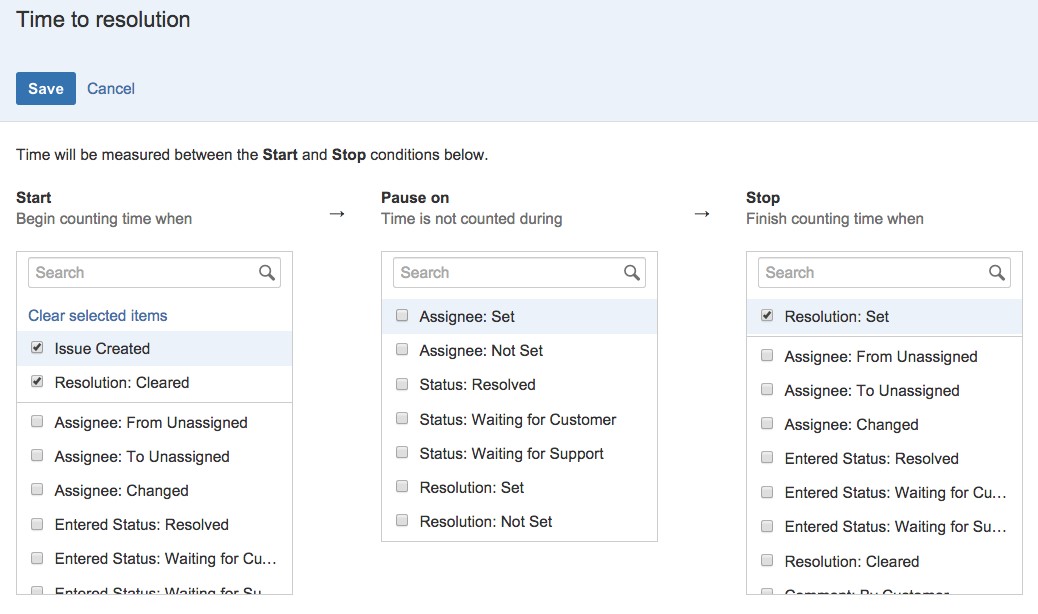
While the time conditions on an SLA specify what your team considers to be trackable time, the goal section of the SLA metric lets you set the amount of time that's allowed for different scenarios.
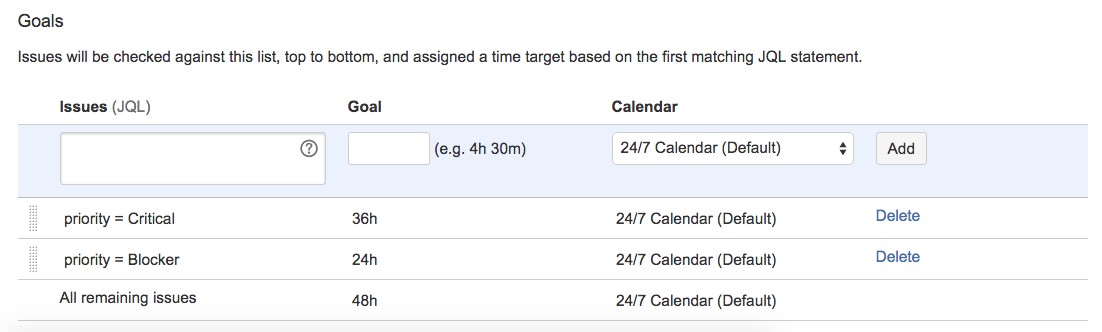
We can define SLA Calendars in order to specify team's working hours. For example, SLA calendars let you exclude night-time, holidays, or weekends from the time that affects the SLA metrics. It is important to take into account that for computing the SLA we exclude the weekend days.
Once that the SLA is configured by the Jira administrators, team members can see a read-only version of the SLA tab so they can view how the SLA is configured. In the detailed view, the SLA section lists even more detail about the SLA that the issue is being measured against.
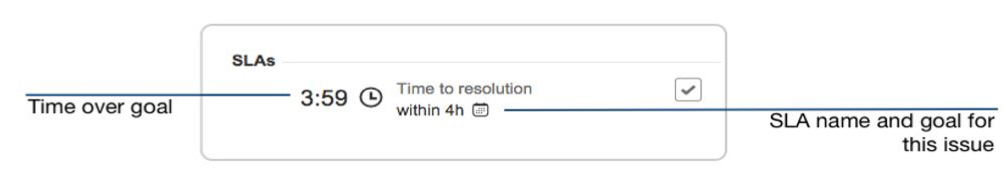
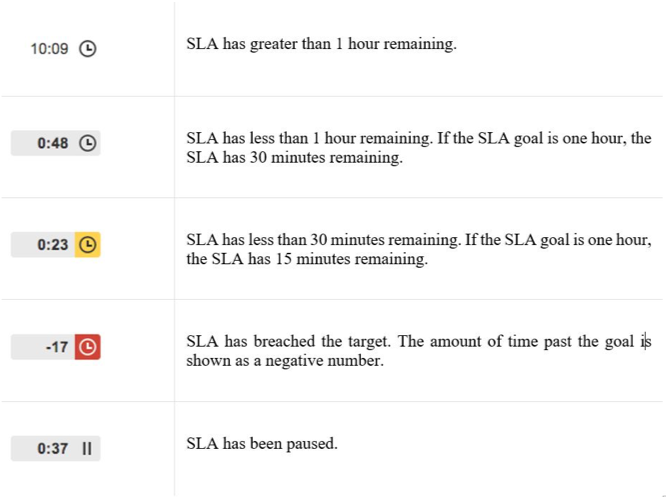
The SLA tracker uses colours to indicate the urgency of a given SLA for an issue based on the time remaining. In the following figure, you can see the description of the colours that are offered by the JIRA Service Desk.
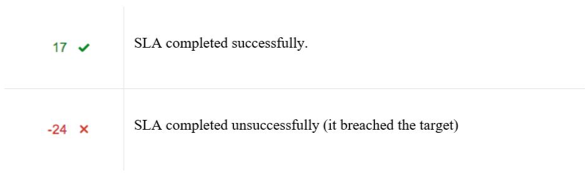
A completed SLA displays the time remaining when the SLA was completed (or the amount of time breached) and an icon to indicate whether the SLA was completed successfully or unsuccessfully.
As an overall result, we can access this information through JIRA API and in that case, we can, through a script, compute the number of tickets in progress by the end of the day and evaluate if it is below 95% over the SLA monitoring period, which will be considered a violation.
As regards ticket resolution, the operation will be the same. A script computes the resolution time for each ticket assigned to a node over the SLA monitoring period, and compute the number of tickets that are closed within 48 hours (the script will consider properly also weekends or holidays), should be this number below 95% over the last SLA monitoring period, it will be considered a violation.