FIWARE Lab Infographic
FIWARE Lab Infographics and Status Pages are simple but important services to allow users to:
-
Know in an intuitive way the infrastructure capacities made available by FIWARE Lab infrastructure;
-
Monitor current status of infrastructure services and know about any issue in any node of FIWARE Lab infrastructure.
While the information on infrastructure capacities is more related to marketing, the one on services status is extremely important to support Developers and Federation Managers operations. The production URL of the Infographics is the following:
This component provides capacity information about the different OpenStack regions and status information of infrastructure services. The Federation Monitor component exposes data on the capacity and status of FIWARE Lab infrastructure through a set of RESTful API that Infographics and Status Pages call in order to get that data.
For more details, it is recommended to refer to the main documentation included in the software repository: https://github.com/SmartInfrastructures/fi-lab-infographics.
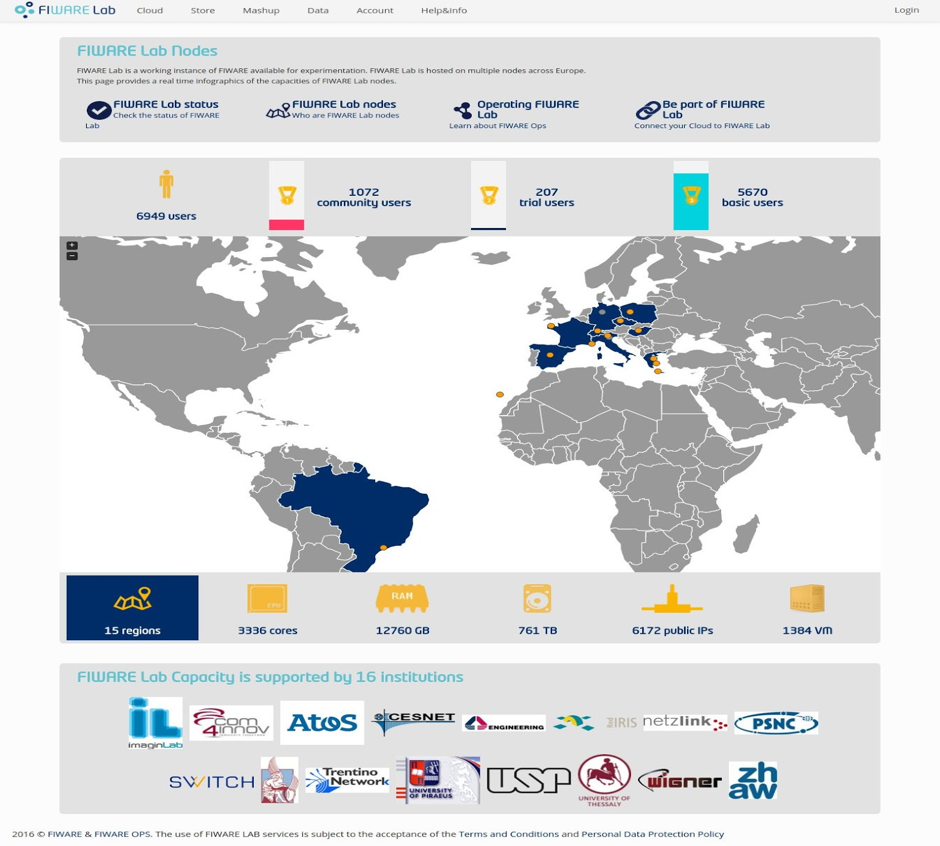
Figure below shows the main page of the Infographics tool. It is comprised of:
-
a user’s section: it shows the total number of users as sum of Trial and Community users;
-
a map that shows all nodes;
-
display different data (number of regions, total number of cores, RAM, and HDD, total number of IPs and the total number of virtual machines currently deployed);
-
the list of FIWARE Lab Capacity supporters;
When data about a specific node are obsolete, the node in the map is grey and the user can check the timestamp of its last update by passing the cursor over it.
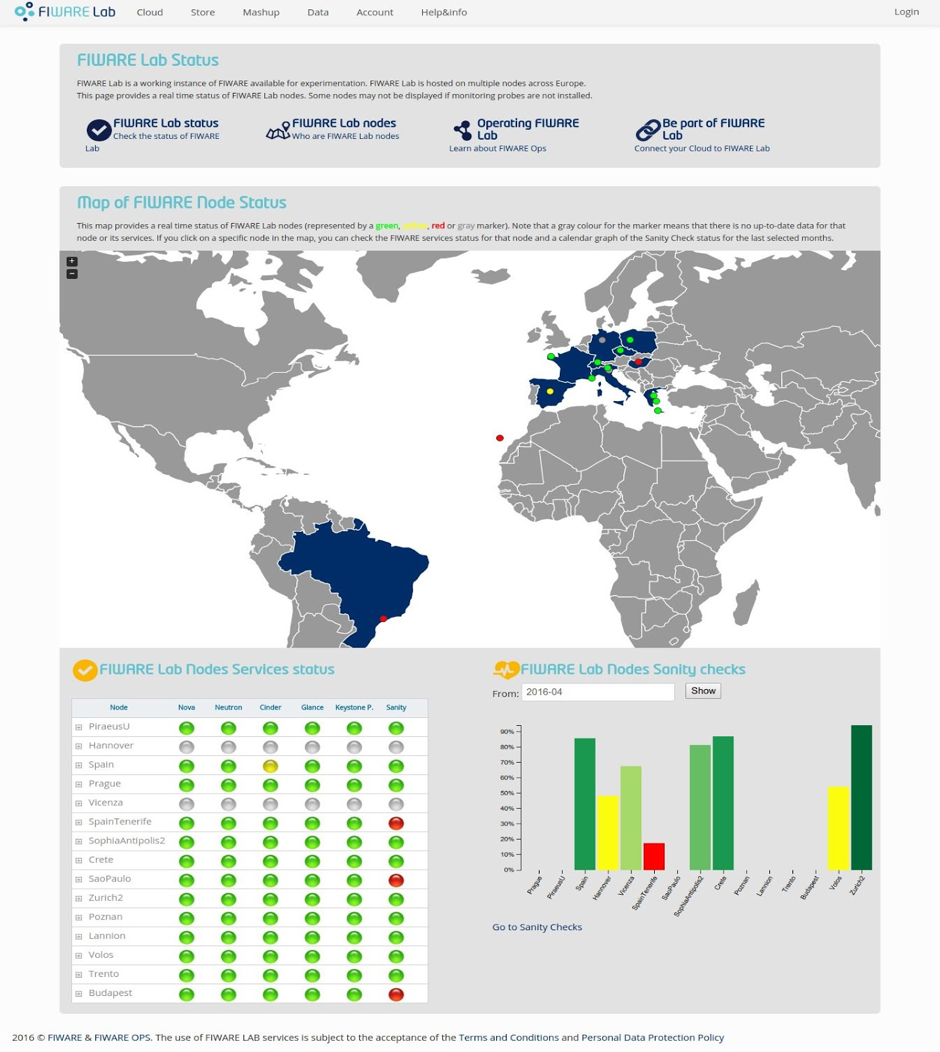
The Status page depicted below is composed by:
-
a big map that shows all the nodes and their overall status (green, yellow or red);
-
a table showing the current status of all the FIWARE Lab nodes services together with the FI-Health Sanity Check status (FIHealth Sanity Check executes periodically a set of tests on the nodes in order to verify if the basic functionalities are guaranteed);
-
a histogram that shows the average on the last selected months of the Sanity Check status for each node.